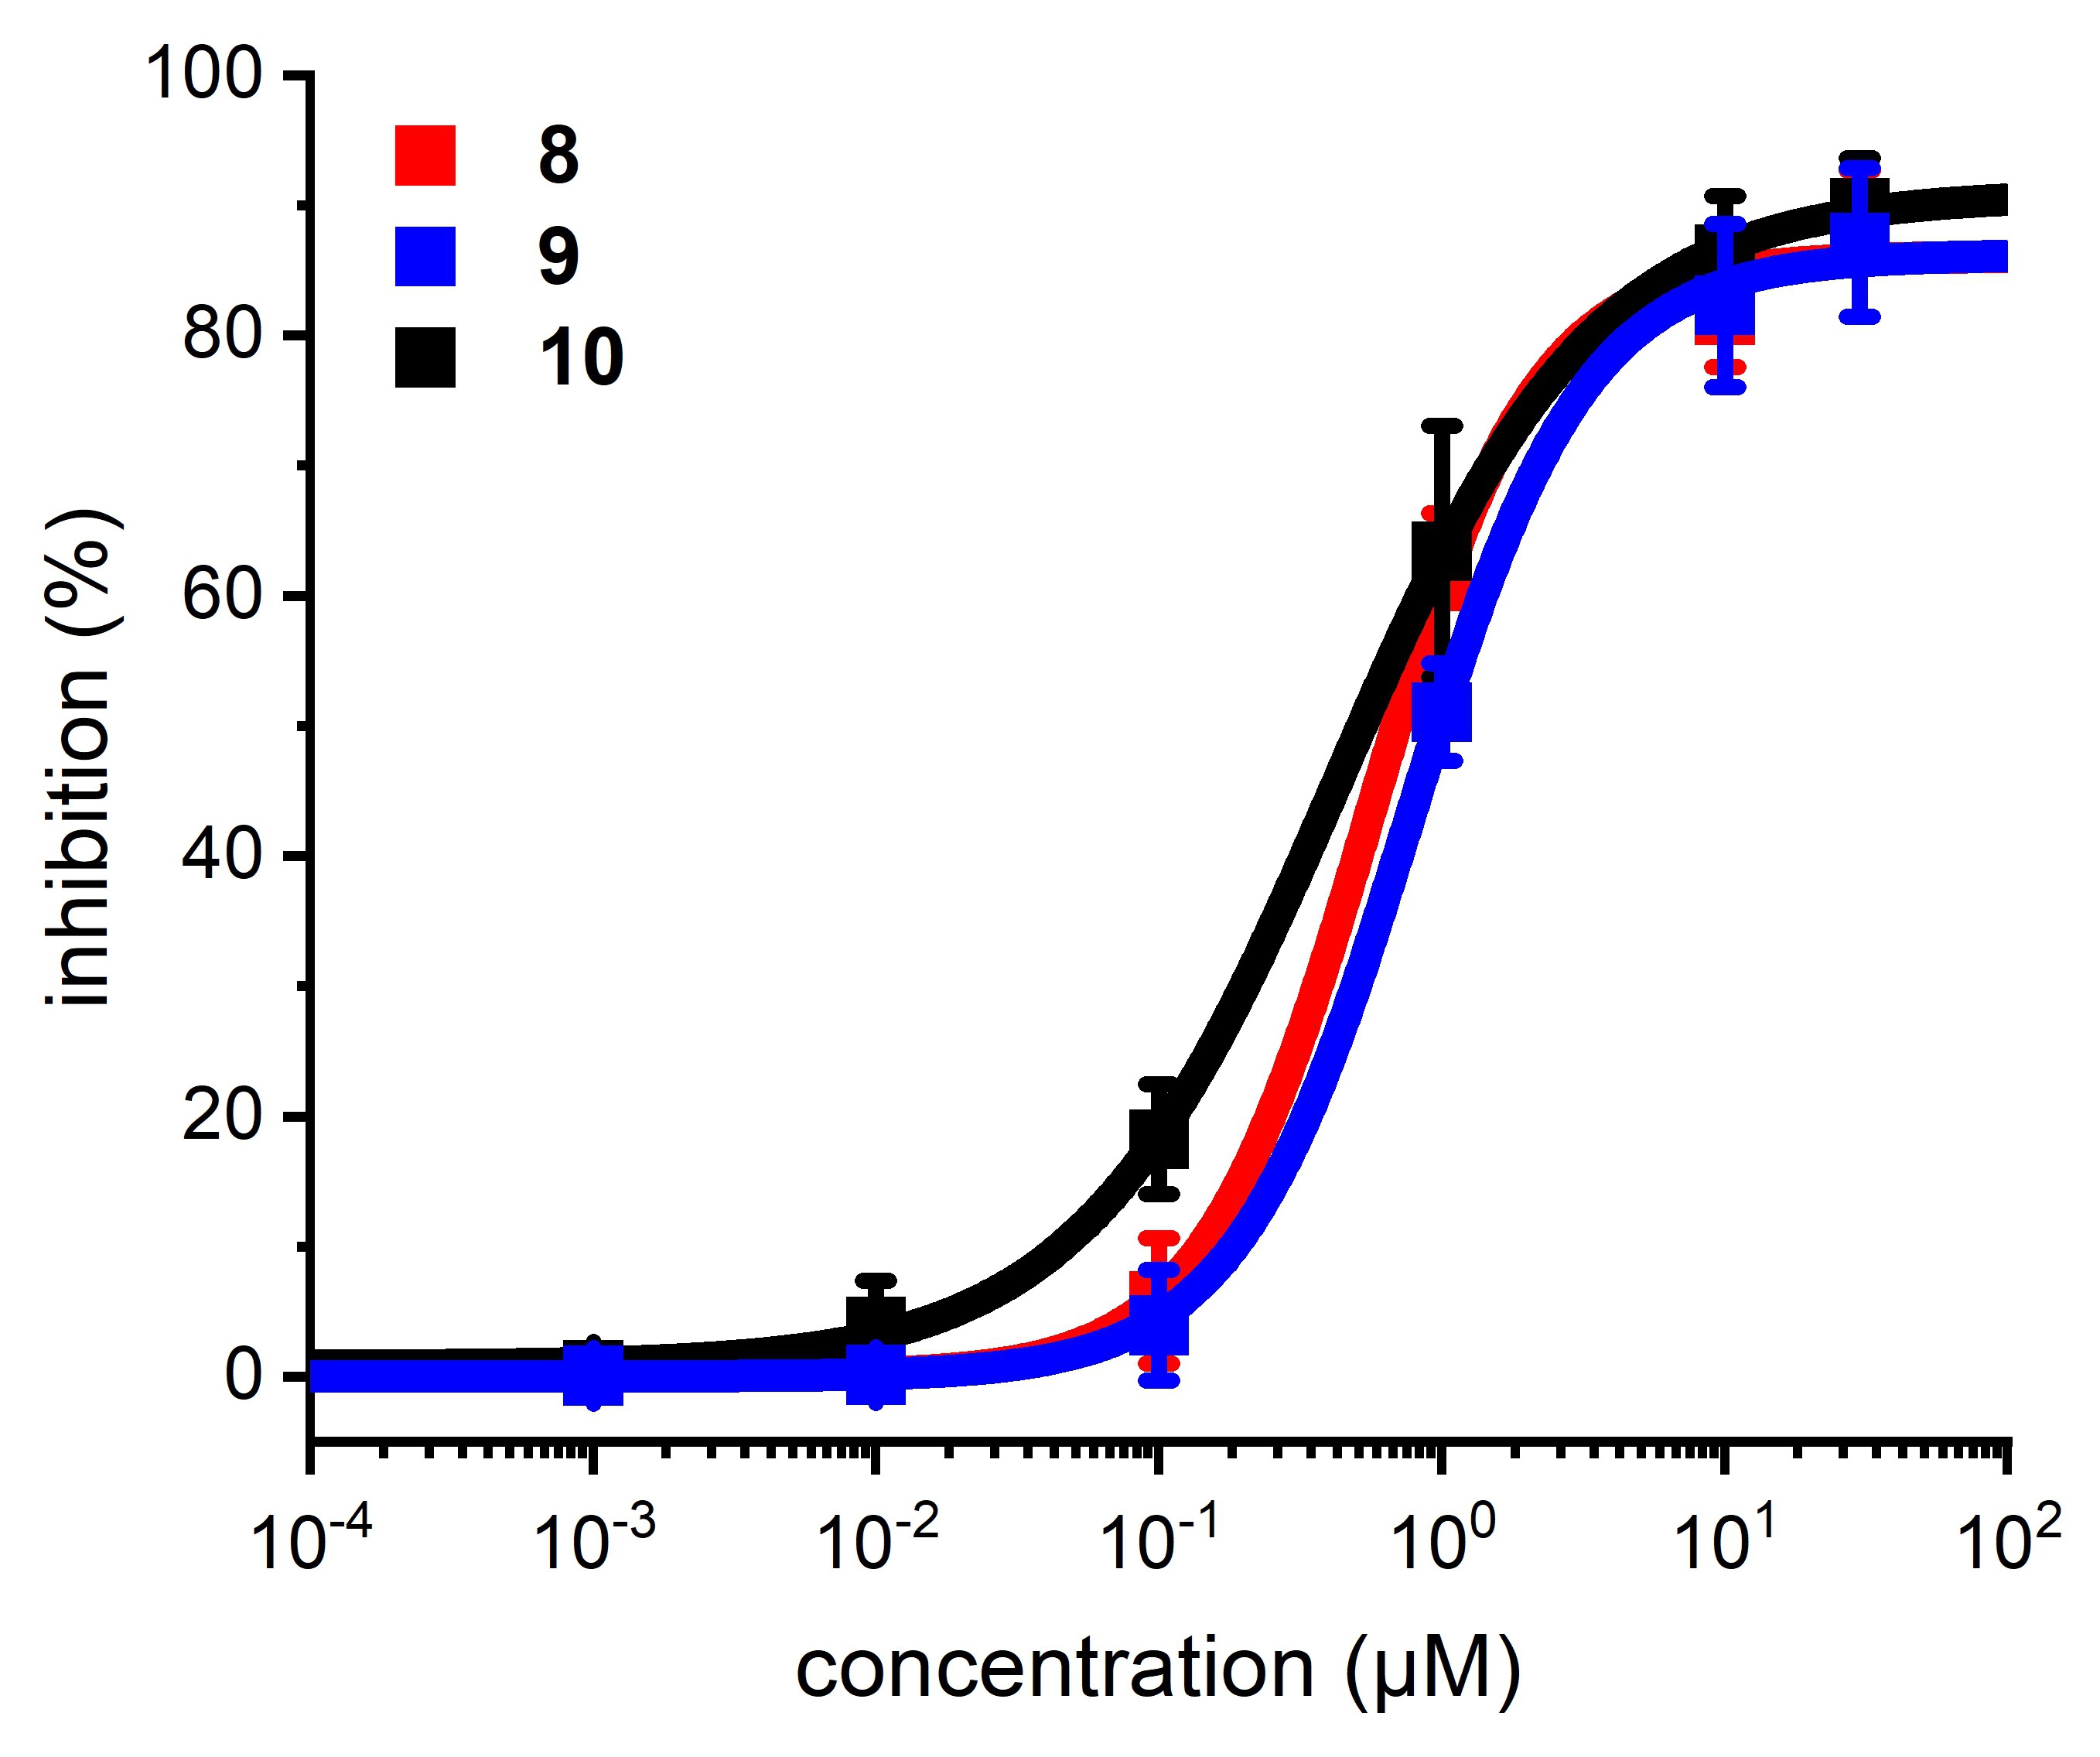
Fig. 8. Dose-response curves derived from inhibition of GluN1-1a/GluN2B expressing oocytes at ascending concentrations of compound 8 (red), 9 (blue) and 10 (black), respectively. The holding potential was set to -70 mV and the receptors were activated by 10 µM glycine and 10 µM glutamate.